How Much Does Power BI Implementation Cost?
Power BI implementation cost is not determined by the number of charts. It is driven by data complexity, architecture, security, refresh needs, user adoption, and how much manual reporting the business wants to replace.
Power BI implementation cost: quick answer
The cost of implementing Power BI depends on what the business needs the reporting system to do. A focused dashboard using one clean data source is a very different project from an enterprise implementation that combines CRM, ERP, accounting, spreadsheets, SQL Server, row-level security, and executive reporting.
Exact pricing should come after discovery. Any estimate made without reviewing data sources, KPI definitions, security needs, report volume, refresh requirements, and user groups is only a guess. A practical estimate should separate implementation work from ongoing operating costs such as licenses, support, and enhancements.
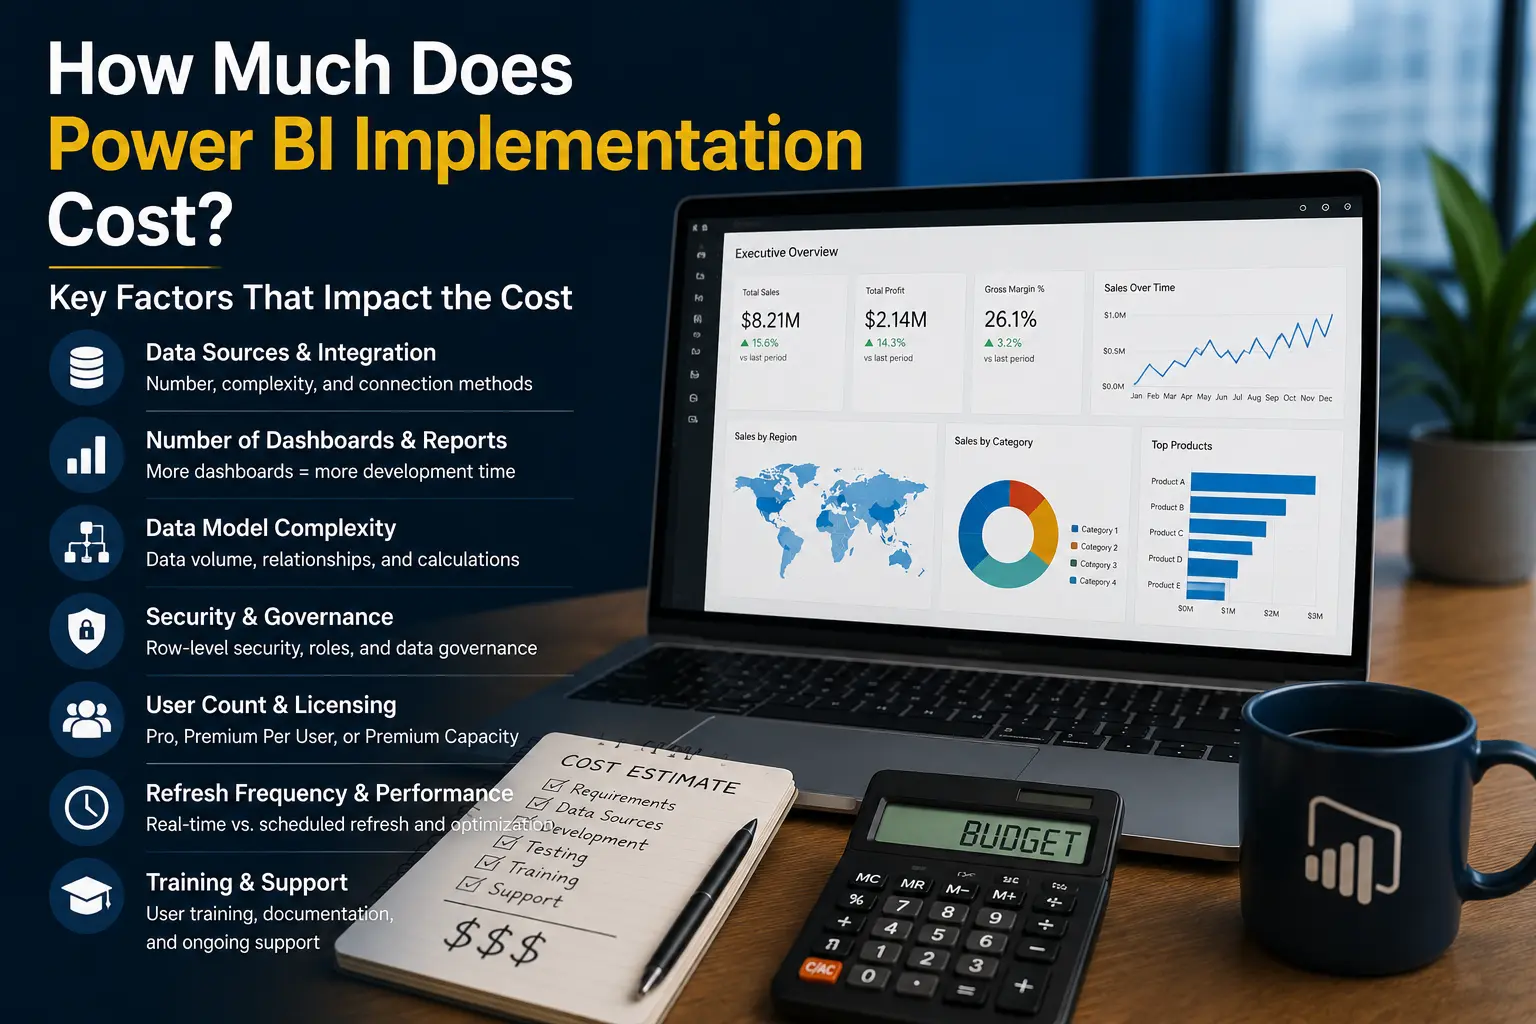
Power BI implementation cost drivers
1. Number and type of data sources
A dashboard connected to one well-structured SQL table is usually simpler than a dashboard that combines CRM exports, accounting data, SharePoint files, ERP tables, and manually maintained spreadsheets. Each source adds connection work, validation, transformation, and failure points.
2. Data quality and cleanup
Messy data increases cost because it requires investigation and decisions. Duplicate customers, missing IDs, inconsistent date fields, changed column names, and manually adjusted spreadsheets all require cleanup rules. Power BI can transform data, but someone must decide what the correct business logic is.
3. KPI definition complexity
Some metrics are straightforward. Others require business rules. Revenue might mean booked revenue, invoiced revenue, recognized revenue, or collected cash. Margin might exclude certain expenses. A good implementation documents these definitions so reports do not create arguments later.
4. Number of dashboards and pages
More dashboards increase development and testing effort, but dashboard count is not the only factor. A single executive dashboard with complex security and multiple sources can take more effort than several simple operational pages.
5. Security requirements
Row-level security, sensitive finance data, executive-only pages, external sharing, and data export restrictions all add design and testing. Security should be part of the scope from the start, not an afterthought near deployment.
6. Refresh frequency and reliability
Daily refresh is simpler than hourly or near-real-time reporting. More frequent refresh may require gateway planning, source system tuning, incremental refresh, DirectQuery evaluation, or a data warehouse.
7. Data volume and performance
Larger models require better architecture. High-volume fact tables, wide columns, text-heavy fields, and complex DAX can make reports slow. Performance tuning is part of implementation when reports need to be used in live business meetings.
8. Training, documentation, and support
A dashboard that nobody understands has low value. Training, documentation, support, and post-launch improvement should be included in the plan, especially for leadership or operational reports used every week.
Cost comparison by project scope
A useful first phase often focuses on one high-value reporting process, such as executive KPIs, sales pipeline, finance reporting, or operations performance. That phase can prove the model, validate data, and create patterns for future reports.
Power BI licensing and operating cost
Licenses are separate from consulting or development work, but they affect the total cost of ownership. The licensing decision depends on creators, consumers, workspace design, sharing model, and whether the organization needs Pro, Premium Per User, or Fabric capacity.
Licensing should be planned alongside architecture. A report built for ten Pro users may need a different distribution model when it expands to hundreds of consumers. For a deeper comparison, see our guide to Power BI Pro vs Premium.
How to control Power BI implementation cost
- Prioritize business decisions: build reports that support real management actions.
- Start with a focused scope: prove value with a high-impact dashboard before expanding.
- Clean data upstream where possible: avoid repeating heavy cleanup in every report.
- Use reusable models: create shared measures and dimensions instead of isolated dashboards.
- Define security early: late security changes can force model redesign.
- Document KPI definitions: avoid rework caused by metric disagreement.
- Plan support: reports need maintenance as systems and business rules change.
The lowest-cost implementation is not always the cheapest initial build. A rushed report that must be rebuilt three months later is expensive. A well-scoped implementation creates a foundation that can support future reporting.
What a proper Power BI discovery should include
A reliable estimate starts with discovery. Discovery does not need to be slow, but it does need to be specific. The goal is to understand the reporting process before committing to a build plan. If the current process depends on Excel exports, undocumented formulas, or manual adjustments, that work must be understood before it can be automated.
Discovery should review the business audience, the decisions the reports support, the source systems, data quality, refresh timing, security requirements, and the current pain points. It should also identify which reports are truly needed. Many companies have legacy reports that are still produced even though nobody uses them to make decisions.
Questions that improve cost estimates
- Which departments will use the first release?
- Which reports are business-critical?
- Which systems contain the source data?
- Are KPI definitions already documented?
- Does the report need row-level security?
- How often must the data refresh?
- Who will support the report after launch?
Clear answers reduce uncertainty. Unclear answers do not mean the project cannot proceed, but they should be reflected in scope and risk.
Phased implementation can reduce risk
A phased approach often controls cost better than a broad first release. Phase one might focus on one executive dashboard, one finance report, or one operations workflow. The point is to validate the data model, security approach, refresh process, and user feedback before expanding.
Phase two can add more dashboards, new data sources, deeper drillthrough, or self-service reporting. Phase three might introduce stronger governance, certified semantic models, or a warehouse layer if the reporting program grows. This approach keeps early investment focused while still building toward a scalable architecture.
Cost questions executives should ask
Executives do not need to review every technical detail, but they should ask questions that connect implementation cost to business value. What manual process will this replace? Which decisions will become faster? Which reports can be retired? Which team owns the data after launch?
These questions matter because the cost of Power BI is not only the cost to build dashboards. There is also the cost of bad reporting: time spent reconciling numbers, delayed decisions, duplicate spreadsheets, and meetings where leaders debate data instead of acting on it.
A good scope should explain what the first release includes, what it excludes, what risks remain, and what future phases may require. It should also explain what the client team must provide, such as access to systems, sample reports, KPI definitions, subject matter experts, and timely feedback.
What should be included in a Power BI proposal?
A useful proposal should clearly separate discovery, data preparation, semantic modeling, dashboard development, testing, deployment, training, and support. If these items are not separated, it becomes difficult to know what is included and what will become an extra charge later.
The proposal should also name assumptions. For example, it may assume that source data is accessible, stakeholders are available for validation, and KPI definitions can be approved within a certain timeline. Assumptions are not a problem. Hidden assumptions are the problem.
Finally, the proposal should explain how changes will be handled. Power BI projects often evolve once stakeholders see the first version. A clear change process protects both the budget and the quality of the final solution.
A proposal that makes scope, assumptions, responsibilities, and support visible is easier for business leaders to evaluate than a simple dashboard estimate.
That level of detail also helps teams compare internal delivery against outside help. If internal staff already understand the data model, SQL layer, security, and deployment process, consulting needs may be narrower. If the team is already overloaded with operations and support work, outside implementation support can reduce delays and avoid design shortcuts.
Conclusion: estimating Power BI implementation cost
Power BI implementation cost depends on the business problem, data complexity, security, reporting scope, and support needs. The right way to estimate cost is to start with discovery: identify the decisions, sources, data quality issues, dashboards, users, and governance requirements.
WillDuet helps businesses scope Power BI implementation, dashboard development, reporting automation, data engineering, and optimization work in a practical way. The goal is to build reporting that is useful, maintainable, and aligned with business value.
Need a realistic Power BI scope?
WILLDUET can help you identify cost drivers, reduce avoidable rework, and plan a Power BI implementation around business value.
Frequently asked questions
How much does Power BI implementation cost?
Power BI implementation cost depends on scope. Major drivers include data sources, dashboard complexity, data quality, security, refresh frequency, data volume, licensing, documentation, and support.
Why should pricing not be based only on the number of dashboards?
Two dashboards can have very different effort. One may use a clean SQL view, while another requires multiple sources, data cleanup, row-level security, and performance tuning.
Do Power BI licenses count as implementation cost?
Licenses are usually an operating cost, but they should be planned during implementation because they affect sharing, workspace design, governance, and rollout.
What makes a Power BI project more complex?
Complexity increases with messy data, many sources, unclear KPI definitions, large models, near-real-time needs, advanced security, and enterprise deployment requirements.
Can Power BI reduce reporting costs?
It can reduce manual reporting effort, spreadsheet maintenance, and decision delays when implemented correctly. The savings depend on the current reporting process and adoption.
Should businesses start with a smaller Power BI scope?
Often yes. A focused first phase can validate data, define core KPIs, prove value, and create a foundation for additional dashboards.