
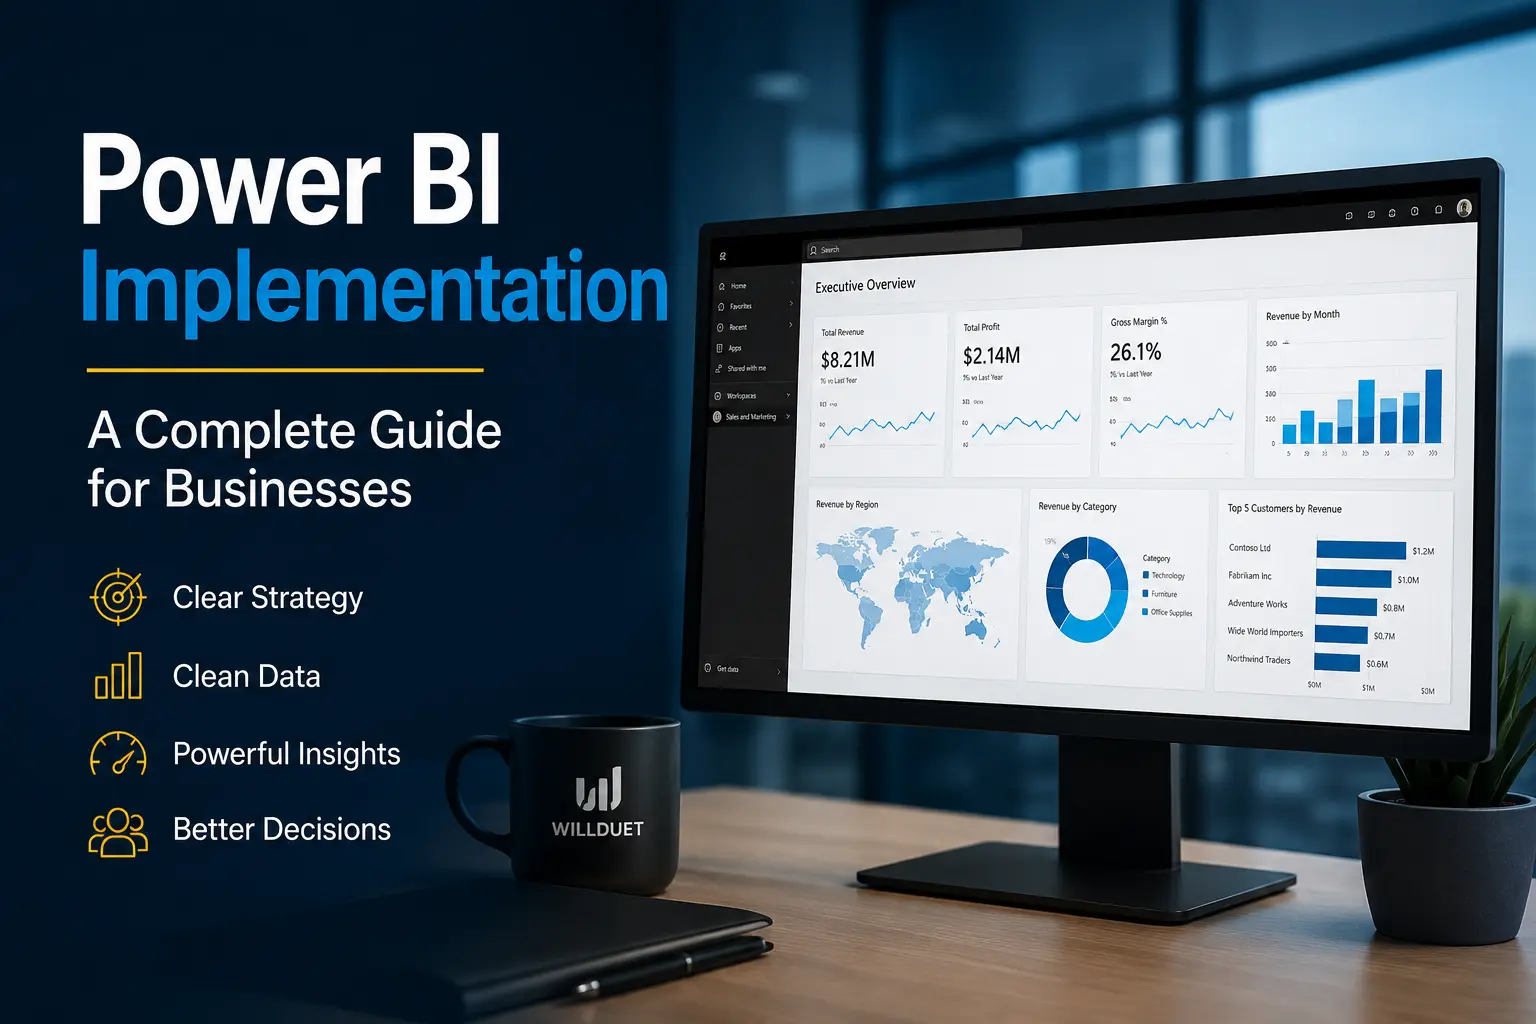
Power BI Implementation: A Complete Guide for Businesses
A practical guide for leaders planning Power BI implementation services, evaluating a Power BI implementation partner, or deciding how to replace spreadsheet-heavy reporting with governed business intelligence.
Introduction
Organizations implement Power BI because they need better visibility into the business. Leaders want reliable dashboards, managers want fewer manual reports, finance teams want consistent KPIs, and IT teams want reporting that does not depend on fragile spreadsheet workflows.
The usual starting point is familiar: Excel files move through email, different departments maintain their own versions of the numbers, and weekly reporting depends on exports from accounting systems, CRMs, ERPs, operations platforms, or SQL databases. The process may work when the company is small, but it becomes expensive as data grows and decisions become more time-sensitive.
Power BI can solve many of these problems, but only when it is implemented as a business system. Installing Power BI Desktop and building a few visuals is not enough. A serious Power BI implementation connects the right data sources, defines business logic, designs a scalable model, secures sensitive data, deploys reports correctly, and trains users to act on the information.
This Power BI implementation guide explains what businesses should plan before hiring Power BI implementation consultants or starting an internal project.
What is Power BI Implementation?
Power BI implementation is the full process of turning business data into reliable, secure, and maintainable Power BI reporting. It includes discovery, architecture, data preparation, data modeling, dashboard development, security, deployment, training, and support.
A proper implementation answers more than "Can we make a dashboard?" It answers:
- Which business decisions should the reports support?
- Which data sources are trusted enough for reporting?
- How should data be cleaned, transformed, and refreshed?
- Where should KPI definitions live so everyone uses the same logic?
- Who should see each report, page, row, or metric?
- How will reports be deployed, documented, supported, and improved?
For some companies, implementation may start with one executive dashboard. For others, it means a governed BI environment with shared semantic models, Power BI apps, deployment pipelines, row-level security, data gateways, and integration with a warehouse or Microsoft Fabric.
Signs Your Business Needs Power BI
Power BI is not necessary for every report. A simple spreadsheet can be fine for one-time analysis. Power BI becomes valuable when reporting is repeated, important, collaborative, or too slow to produce manually.
Reports depend on manual Excel work
If employees spend hours exporting data, copying formulas, fixing pivots, and emailing files, the reporting process is consuming time that should be spent on analysis.
Teams disagree on numbers
When finance, sales, and operations each have a different revenue number, the issue is usually inconsistent definitions, disconnected data, or both.
Leadership lacks timely visibility
Executives should not wait until Friday afternoon to understand what happened on Monday. Refreshable dashboards reduce reporting delay.
Source systems are fragmented
Power BI can combine data from CRM, ERP, SQL Server, spreadsheets, SharePoint, cloud apps, and warehouses into a single reporting experience.
Another sign is that reporting has become too risky. If one broken spreadsheet formula can change the management view of revenue, margin, inventory, or cash flow, the reporting process needs stronger controls.
Benefits of a Proper Power BI Implementation
The main benefit of Power BI is not prettier charts. The business value comes from faster decisions, trusted metrics, reduced manual work, and better operational control.
A well-designed implementation also reduces future cost. When the first model is built correctly, new reports can reuse clean dimensions, measures, and security rules. When the first model is rushed, every new dashboard becomes another isolated project.
Typical Power BI Implementation Process
The exact process depends on the company, but most successful Power BI implementation services follow the same sequence.
1. Requirements gathering
Start with business questions, not visuals. Identify the decisions the reports must support, the people who will use them, and the actions those users should take. A CFO may need margin and cash flow visibility. An operations director may need backlog, cycle time, and capacity. A BI manager may need governed self-service reporting.
Requirements should include KPIs, filters, drill paths, refresh needs, access rules, source systems, and acceptance criteria. If a metric is important, define it in plain language before development starts.
2. Data discovery
Data discovery identifies where the data lives, how it is structured, how reliable it is, and whether it can support the requested reporting. This step often uncovers missing keys, inconsistent customer names, duplicated records, late-arriving data, or manual spreadsheets that are treated as system data.
The output should be a realistic data plan. Some data can be used immediately. Some needs cleaning. Some may require SQL views, dataflows, a warehouse, or changes to upstream processes.
3. Data modeling
Data modeling is where Power BI projects often succeed or fail. A good model separates facts, dimensions, relationships, measures, and business definitions. It avoids giant flat tables when a star schema would be clearer and faster.
For example, a sales model might include a sales fact table and separate dimensions for date, customer, product, region, salesperson, and channel. This structure makes filtering easier, improves maintainability, and supports multiple dashboards from the same foundation.
4. ETL and Power Query
ETL work prepares data before it reaches visuals. In Power BI, this can include Power Query transformations, SQL views, dataflows, pipelines, or warehouse logic. The right choice depends on data volume, source systems, governance, and who will maintain the solution.
Keep transformations as close to the right layer as possible. Heavy joins and repeated business rules may belong in SQL or a warehouse. Lightweight cleanup, column shaping, and source-specific transformations can often be handled in Power Query.
5. Dashboard development
Dashboard development should follow the user workflow. Start with summary information, then provide paths to explain the result. A report page should not try to answer every question at once. Use focused pages, drillthrough, tooltips, slicers, and bookmarks when they help users investigate without clutter.
Build with performance in mind. Large tables, too many visuals, complex measures, and poorly filtered pages can make adoption fail even when the data is correct.
6. Security
Security includes workspace roles, app distribution, Microsoft Entra groups, row-level security, object-level security where appropriate, data gateway access, and tenant settings. It also includes simple decisions such as who can export data, build on top of a semantic model, or share content externally.
Do not wait until the end to discuss security. If sales managers should only see their regions, or finance data should be restricted to specific roles, that design affects the model and testing plan.
7. Deployment
Deployment moves reports from development to business use. For smaller teams, this may be a controlled workspace and Power BI app. For larger organizations, it may include separate development, test, and production workspaces, deployment pipelines, naming standards, endorsement, and release notes.
Deployment should also include refresh configuration, gateway setup, credential management, app permissions, and a rollback plan when changes affect critical reports.
8. User training
Training should focus on how people will use the reports in their jobs. Executives need to understand the KPI logic and navigation. Managers need to filter, drill, export when allowed, and interpret exceptions. Analysts may need to build from certified semantic models.
A short live training session with examples from the actual report is usually more useful than generic tool training.
9. Ongoing support
Reports need maintenance. Source systems change, new metrics are requested, refreshes fail, users need access, and business definitions evolve. Ongoing support keeps the implementation from becoming another unmanaged reporting layer.
Support should include monitoring refreshes, improving performance, documenting changes, managing access, and reviewing whether reports are still being used.
Common Power BI Implementation Challenges
Power BI implementation challenges are usually not caused by the visual layer. Most come from data quality, modeling, performance, governance, and security decisions made too late.
Poor data quality
Bad data cannot be fixed by a better chart. Common issues include duplicate customers, missing product IDs, inconsistent dates, manual overrides, incomplete transactions, and fields that mean different things in different systems.
The practical fix is to profile data early, document known issues, agree on cleansing rules, and assign ownership. If nobody owns customer master data, the Power BI report will expose the problem but will not solve it by itself.
Slow reports
Slow reports damage trust. Users will avoid a dashboard that freezes during meetings, even if the numbers are accurate. Performance problems often come from oversized models, too many visuals, inefficient DAX, high-cardinality columns, poor relationships, or source systems that cannot handle live queries.
Start with model design, remove unused columns, reduce unnecessary history, use efficient relationships, and test important pages before deployment.
Bad data models
A common mistake is importing a large operational table and building every report directly on top of it. That may work for a prototype, but it becomes difficult to maintain as reporting grows.
Use clear fact and dimension tables. Hide technical columns. Name measures in business language. Create reusable measures instead of embedding logic into individual visuals.
DirectQuery misuse
DirectQuery is useful in the right situation, but it is not a universal performance solution. It sends queries back to the source, so report speed depends heavily on source performance, model design, network latency, query complexity, and the number of visuals.
Use Import mode when the business can tolerate scheduled refresh and wants fast interactive reports. Consider DirectQuery when data is too large to import, must remain in the source, or requires near-real-time access. Test before committing.
Lack of governance
Without governance, Power BI can become the same problem as Excel at a larger scale: duplicated reports, unclear ownership, inconsistent metrics, and too many workspaces. Governance does not need to be heavy, but it must be intentional.
Define workspace naming, report ownership, promotion rules, certified datasets, app distribution, access request process, and who is allowed to publish to production.
Security mistakes
Security mistakes include giving edit access to too many users, sharing reports directly instead of through apps, failing to test row-level security, exposing sensitive columns, or allowing exports where data should remain controlled.
Test security with real user scenarios. A report is not secure because the model contains a role. It is secure when the right users have the right access in the Power BI service.
Power BI Licensing Considerations
Licensing should be planned before rollout because it affects sharing, collaboration, capacity, and user adoption. Microsoft licensing changes over time, so verify final decisions against current Microsoft documentation and pricing before purchase.
As a practical recommendation, start by mapping users into creators, reviewers, consumers, administrators, and external users. Then choose licensing based on how each group will actually use the platform. Avoid buying capacity only because it sounds enterprise-grade, and avoid under-licensing if it will block adoption.
How Much Does Power BI Implementation Cost?
Power BI implementation cost varies widely, and exact pricing should be scoped after discovery. A single departmental dashboard is very different from a multi-source executive reporting platform with security, gateways, data modeling, and ongoing support.
The biggest cost drivers are:
- Number of data sources: one clean SQL database is simpler than five cloud systems, spreadsheets, and an ERP.
- Data complexity: inconsistent definitions, missing keys, and messy historical data increase effort.
- Number of dashboards: each report needs design, development, testing, and user feedback.
- Security requirements: row-level security, sensitive finance data, external sharing, and compliance needs add design and testing.
- Refresh frequency: daily refresh is usually simpler than near-real-time reporting.
- Data volume: larger models require more careful architecture and performance tuning.
- User count: more users can mean more licensing planning, training, support, and governance.
Businesses should also separate implementation cost from operating cost. Implementation covers design and build. Operating cost includes licenses, capacity, gateway maintenance, support, enhancements, and governance.
A useful scoping question is: "What business process will improve if this implementation succeeds?" If the answer is executive visibility, faster month-end reporting, sales pipeline control, or reduced manual work, the project can be evaluated against measurable business value instead of only development hours.
How to Choose a Power BI Implementation Partner
The right Power BI implementation partner should understand both BI architecture and business operations. A dashboard designer can build visuals. A partner should help you make decisions about data, performance, governance, deployment, and long-term maintainability.
Evaluate experience
Ask about similar projects, data sources, industries, and reporting use cases. Experience matters most when requirements are unclear or data is messy, because those are the situations where implementation risk is highest.
Evaluate architecture knowledge
The partner should explain how they approach semantic models, star schema design, SQL views, Power Query, dataflows, gateways, deployment, and workspace structure. If every answer is "we will build a dashboard," the solution may not scale.
Evaluate performance optimization
Ask how they diagnose slow reports. A strong consultant should discuss model size, DAX, relationships, visual queries, DirectQuery tradeoffs, aggregation, and source performance.
Evaluate governance and documentation
A good partner documents KPI definitions, data sources, refresh schedules, security roles, assumptions, and known limitations. Documentation is not paperwork for its own sake. It helps your team support the system after launch.
Evaluate support
Reports change after deployment. Choose Power BI implementation consultants who can support enhancements, troubleshoot refresh failures, optimize slow pages, and help your users adopt the reports.
Evaluate industry expertise
Industry knowledge can shorten discovery because the partner understands common metrics, data patterns, and operational problems. It should not replace discovery, but it can make it more efficient.
Why Companies Choose WillDuet
WillDuet helps organizations implement Power BI in a practical way: with clean data models, reliable dashboards, performance-aware design, and reporting processes that business users can understand.
Companies work with WillDuet when they need help to:
- Build scalable Power BI solutions for leadership, finance, operations, and business teams.
- Optimize slow Power BI reports that are hard to use in day-to-day work.
- Design robust data models with clear relationships, reusable measures, and documented definitions.
- Improve reporting processes that currently depend on manual Excel work.
- Implement reporting best practices around refresh, security, deployment, and governance.
The goal is not to create dashboards that look impressive for a demo. The goal is to build reporting that helps leaders make decisions, reduces manual effort, and gives teams a clearer view of business performance.
Frequently Asked Questions
What is Power BI implementation?
Power BI implementation is the process of planning, designing, building, securing, deploying, and supporting Power BI reports, semantic models, refresh processes, and governance practices for business use.
How long does a Power BI implementation take?
The timeline depends on data sources, report complexity, data quality, security needs, and stakeholder availability. A narrow executive dashboard can move quickly, while an enterprise implementation with multiple systems and governance requirements takes longer.
What affects Power BI implementation cost?
Cost is driven by the number of data sources, data volume, number of dashboards, data modeling complexity, refresh frequency, security requirements, licensing approach, documentation, and ongoing support needs.
Do we need a data warehouse before implementing Power BI?
Not always. Some businesses can start with Power BI connected to well-structured source systems. A data warehouse becomes more important when reports depend on multiple systems, historical analysis, reusable metrics, or governed enterprise reporting.
Should Power BI use Import mode or DirectQuery?
Import mode is often the best default for performance and usability. DirectQuery can make sense for very large datasets, near-real-time reporting, or data that must remain in the source system, but it requires careful source performance and model design.
What should a Power BI implementation partner provide?
A strong Power BI implementation partner should provide requirements analysis, architecture guidance, data modeling, ETL design, dashboard development, security setup, performance optimization, documentation, training, and post-launch support.
What are the biggest Power BI implementation challenges?
Common challenges include poor data quality, unclear KPI definitions, slow reports, weak data models, DirectQuery misuse, lack of governance, security mistakes, and insufficient user training.
Conclusion
Power BI implementation is not just a reporting project. It is a data, process, and decision-making project. The best implementations start with business questions, clean up the data path, define metrics clearly, build a scalable model, secure the content, and train users to apply the reports in real work.
If your organization is struggling with Excel reporting, fragmented data, slow dashboards, or inconsistent KPIs, Power BI can help. The key is implementing it with the right architecture and the right operating model from the start.
Planning a Power BI implementation?
WILLDUET helps businesses design, build, optimize, and support Power BI solutions that are practical, scalable, and aligned with real reporting needs.



External Authoritative Sources to Reference
For current platform details, validate implementation decisions against Microsoft documentation.
SEO Publishing Notes
- SEO Title: Power BI Implementation Guide | WILLDUET
- Meta Description: A practical Power BI implementation guide for businesses covering process, cost factors, licensing, challenges, partner selection, and common reporting risks.
- URL Slug: /blogs/power-bi-implementation-guide/
- Suggested H2 hierarchy: What is Power BI Implementation; Signs Your Business Needs Power BI; Benefits of a Proper Power BI Implementation; Typical Power BI Implementation Process; Common Power BI Implementation Challenges; Power BI Licensing Considerations; How Much Does Power BI Implementation Cost; How to Choose a Power BI Implementation Partner; Why Companies Choose WillDuet; Frequently Asked Questions; Conclusion.