Power BI Performance Optimization: 15 Proven Ways to Speed Up Your Reports
Power BI performance optimization matters when reports are too slow for meetings, refreshes fail, or users stop trusting dashboards because every click takes too long.
Why Power BI reports become slow
Power BI reports slow down when the model, calculations, visuals, refresh process, or source systems are doing more work than necessary. A dashboard that worked during a prototype may struggle once more data, users, pages, and measures are added.
Performance is a business issue, not just a technical issue. A slow executive dashboard interrupts meetings. A slow operations report delays action. A slow finance report pushes users back to Excel. Power BI optimization protects adoption.
Power BI performance optimization: 15 ways to speed up reports
1. Remove unused columns
Every imported column adds model size. Remove columns that are not used for relationships, filtering, measures, security, or reporting.
2. Reduce unnecessary rows
Do not load ten years of detail if users only need three years. Keep history that supports decisions, not every available row by default.
3. Use a star schema
Organize fact and dimension tables clearly. A star schema usually improves filtering, usability, and maintainability.
4. Use numeric keys for relationships
Integer relationship keys are usually more efficient than long text fields. Use names for display, not as heavy relationship keys.
5. Avoid unnecessary calculated columns
Calculated columns are stored in the model. Create columns upstream in SQL, Power Query, or a warehouse when that is more efficient.
6. Write focused DAX measures
Measures should answer specific business questions. Avoid repeated expensive logic and use variables where they make formulas clearer.
7. Limit visuals per page
Every visual sends queries. Use focused pages, drillthrough, and detail pages instead of crowding everything onto one screen.
8. Avoid large unfiltered table visuals
Tables and matrices can be expensive. Use filters, Top N views, summary pages, and drillthrough for detail.
9. Review slicer design
Too many slicers on high-cardinality fields can slow interaction. Use practical filters that match how users make decisions.
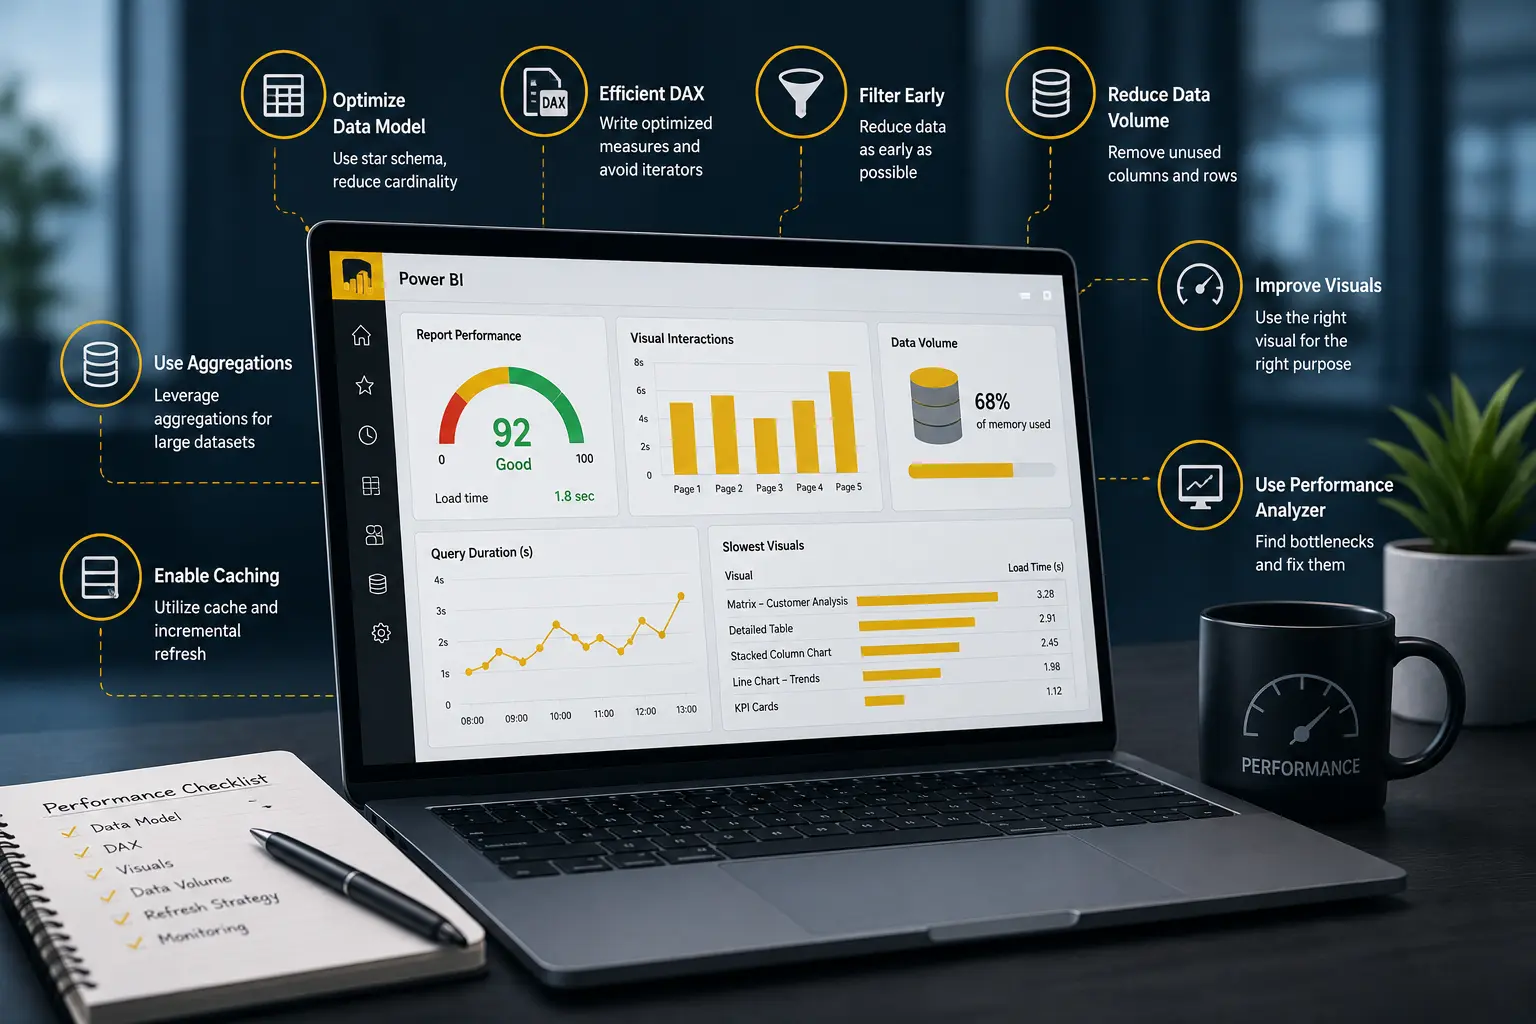
10. Test with Performance Analyzer
Use Performance Analyzer to identify slow visuals, DAX queries, and rendering delays before users experience them.
11. Optimize Power Query steps
Remove unnecessary steps, keep query folding where possible, and avoid transformations that repeatedly process large datasets inefficiently.
12. Move heavy logic upstream
Complex joins, cleansing, and business rules may belong in SQL views, data pipelines, or a warehouse rather than inside every report.
13. Use incremental refresh when appropriate
Large fact tables may not need full refresh every time. Incremental refresh can reduce refresh duration when designed correctly.
14. Be careful with DirectQuery
DirectQuery depends on source performance. It can help in specific scenarios, but it can also make reports slower if the source is not optimized.
15. Monitor refresh failures and usage
Optimization is ongoing. Monitor refreshes, report usage, and user feedback so performance problems are caught early.
Import mode vs DirectQuery for performance
Business examples of Power BI optimization
A finance dashboard may be slow because a large transaction table contains unused columns and many calculated columns. A sales dashboard may be slow because it uses DirectQuery against a CRM replica that is not indexed for analytics. An operations dashboard may be slow because a single page contains too many visuals and unfiltered detail tables.
In each case, the fix is different. Power BI performance optimization starts with diagnosis. For more tactical detail, see how to optimize slow Power BI reports. If performance issues come from source design, read database vs data warehouse.
When to contact a Power BI consultant for optimization
Contact a Power BI consultant when slow reports affect leadership meetings, refresh failures are frequent, the model is difficult to maintain, or internal teams cannot identify the bottleneck. Power BI consulting can help diagnose whether the issue is model design, DAX, visuals, SQL Server, DirectQuery, or data architecture.
Willduet helps businesses with Power BI optimization, dashboard development, SQL Server performance tuning, data engineering, and business intelligence consulting.
How to diagnose Power BI performance problems
Optimization should start with diagnosis. If the report is slow to open, the model may be too large or the first page may contain too many expensive visuals. If slicers are slow, relationships, high-cardinality fields, or DAX measures may be the issue. If refresh fails, the problem may be credentials, gateway reliability, source query speed, or transformations that no longer fold.
Start with the user complaint and trace backward. Which page is slow? Which visual? Which filter selection? Does it happen in Desktop, the service, or both? Does it affect all users or only users under row-level security? These questions prevent teams from applying random fixes.
Separate model, report, and source problems
Model problems include large tables, unnecessary columns, poor relationships, and inefficient measures. Report problems include too many visuals, large tables, excessive slicers, and pages that try to answer too many questions. Source problems include slow SQL views, overloaded databases, unindexed DirectQuery sources, and data pipelines that run too late.
Each layer needs a different fix. Removing visuals will not solve a slow SQL query. Rewriting DAX will not solve a gateway outage. A Power BI consultant can help isolate the bottleneck when the internal team is not sure where the delay starts.
Optimize for the business workflow
Not every page needs the same performance target. A dashboard used in an executive meeting needs to open quickly and respond reliably. A detail page used by analysts can tolerate more complexity if it answers a deeper question. Optimization should prioritize the pages that support high-value decisions.
Power BI optimization priorities for business leaders
Not every performance issue deserves the same level of effort. Start with reports that affect decisions, executives, customers, or high-volume operational work. A slow report used once a quarter may be less urgent than a dashboard reviewed every morning by operations managers.
Leaders should ask what the slow report is costing the business. Is it delaying meetings? Is it causing users to export data and maintain separate spreadsheets? Is it blocking adoption of automated reporting? Is it creating pressure on SQL Server or other source systems? These questions help prioritize optimization work.
A practical optimization plan often has three phases. First, stabilize the report by fixing obvious page and model issues. Second, improve the data model and DAX so the report is easier to maintain. Third, address upstream data architecture if the source systems or transformations are the real bottleneck.
This is why Power BI optimization often overlaps with data engineering and SQL Server performance tuning. The report is only the visible layer. If the model depends on slow views, messy spreadsheets, or repeated transformations, the long-term fix may be outside the report file.
Business leaders should also decide what level of performance is acceptable. A dashboard used by executives during a meeting should feel immediate. A complex analyst drillthrough page may have more tolerance. Defining expectations helps the BI team focus effort where it matters most.
After optimization, document what changed. If columns were removed, measures rewritten, or SQL logic moved upstream, future developers need to understand the decision. Otherwise, the same performance problems can return as reports evolve.
Optimization should also be measured after changes are made. Compare load time, refresh duration, and user feedback before and after the work. This helps leaders see whether the effort improved real business usability rather than only changing technical details.
The best optimization work leaves the report simpler than before. Users should see faster pages, clearer navigation, and fewer unnecessary details. Developers should inherit a model that is easier to extend without recreating the same performance issues.
Treat performance as a quality requirement for every important Power BI dashboard, not as cleanup work after complaints begin.
For executives and operational teams, fast reports protect decision speed. A dashboard that opens quickly, filters predictably, and refreshes reliably is more likely to become part of the daily management process.
Need faster Power BI reports?
Willduet helps teams optimize Power BI models, DAX, report pages, refreshes, SQL queries, and dashboard performance.
Conclusion: Power BI performance optimization
Power BI performance optimization requires attention to model size, relationships, DAX, visuals, refreshes, source systems, and user behavior. Faster reports improve trust and adoption. When reports are business-critical, optimization should be part of the Power BI implementation services plan, not an emergency fix after launch.
Frequently asked questions
What is Power BI performance optimization?
Power BI performance optimization is the process of improving report load time, visual interaction, model size, DAX efficiency, refresh duration, and source query performance.
Why are my Power BI reports slow?
Slow Power BI reports often come from oversized models, too many visuals, inefficient DAX, poor relationships, DirectQuery misuse, high-cardinality columns, or slow source systems.
Should I use DirectQuery to make Power BI faster?
Not automatically. DirectQuery can be useful, but it depends on the source system and query design. Import mode is often faster for interactive reports when scheduled refresh is acceptable.
Does a star schema improve Power BI performance?
A star schema often improves usability, maintainability, and filtering performance because facts and dimensions are organized clearly.
When should a business contact a Power BI consultant for optimization?
Contact a Power BI consultant when dashboards are too slow for meetings, refreshes fail, DAX is hard to maintain, or the model has grown beyond the internal team’s capacity.